A
Event-based accounting which recognizes events when they appear in the system, not at the time they are paid.
See also Cash Basis.


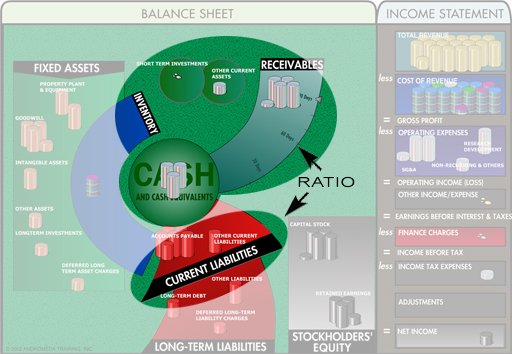
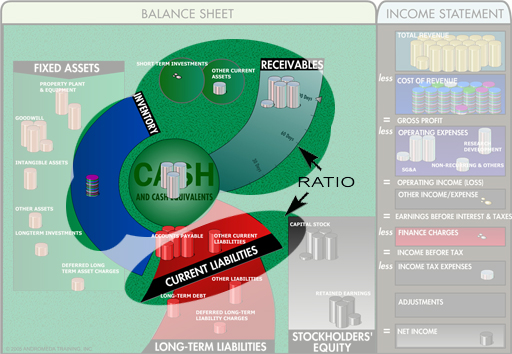
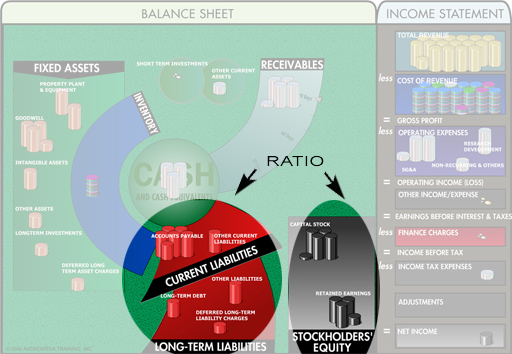
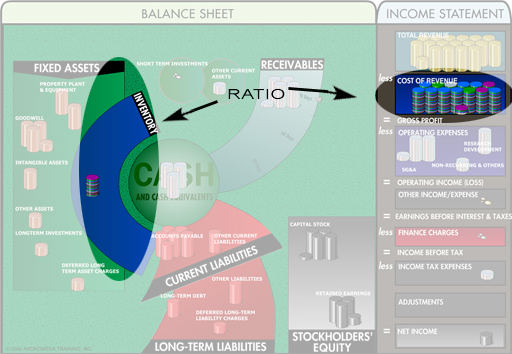
Ratio: (Current Assets less Inventory) divided by Current Liabilities
This is a variant of the cr; it only includes items which are quickly converted into current assets. It is called ‘Acid-Test’ because it measures the ability to meet unexpected demands without depending on the sale of inventory.
Also called Quick Ratio.
1. (Owner’s view) Buying a company when its market value is below bvc, then selling off its component assets to make a profit.
2. (Manager’s view) Selling off non-essential or under-utilized assets of a business in order to improve short-term metrics such as Return On Assets (ROA).
B
C
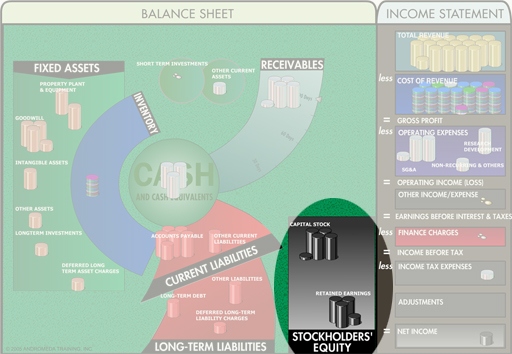
The amount of money invested in the business by shareholders, plus the amount accumulated in profits.
Also referred to as Share Capital, Shareholders’ Equity, or Net Worth.
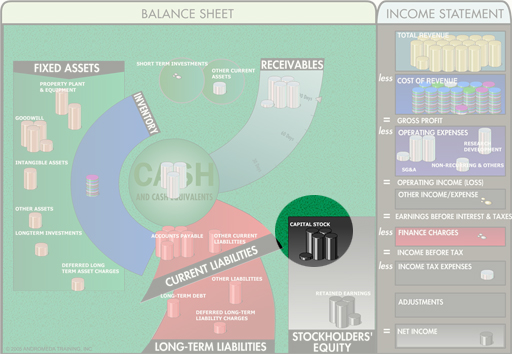
The original investment in the company, plus any additional investment from outside the company.

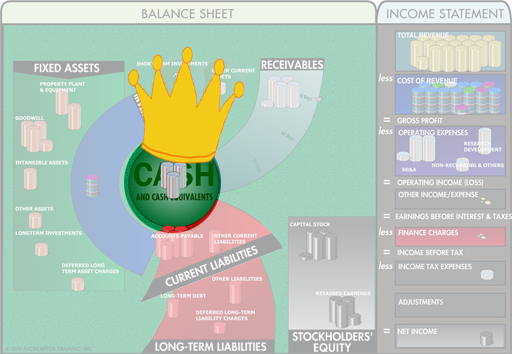
Cash is King!
Cash on hand, in the bank, or otherwise very readily accessible.
See also Profit & Cash.
An accounting method which tracks incomes and outlays by when the cash comes in or goes out, not when events first appear in the system.
See also Accrual Basis.
Analysis of sources of cash that flowed into the business together with how the cash was allocated, for the accounting period.
The information is grouped by functional department, because Cash can be freed up from anywhere (such as getting customers to pay faster, or paying suppliers more slowly), not just from Sales or the Finance Department.
Note: Cash Flow does not consider non-cash items such as depreciation.

CONTRIBUTION
Calculation: Sales less the Cost of Sales (COS).
CONTRIBUTION MARGIN
Ratio: Contribution as a percentage of Sales
Contribution is what’s left from the sale to contribute towards paying for the overhead costs and expenses of the business.
This is a real What do you mean by that? term with people sometimes using the two terms interchangeably. We use ‘margin’ to denote a percentage (of Sales).
Example:
- Sales of 200 less COS of 80 equals Contribution of 120
- Contribution of 120 divided by Sales of 200 equals Contribution Margin of 60%.
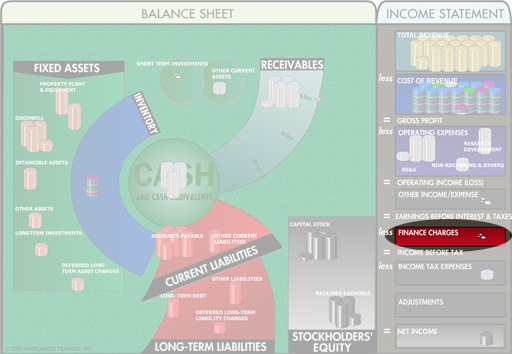
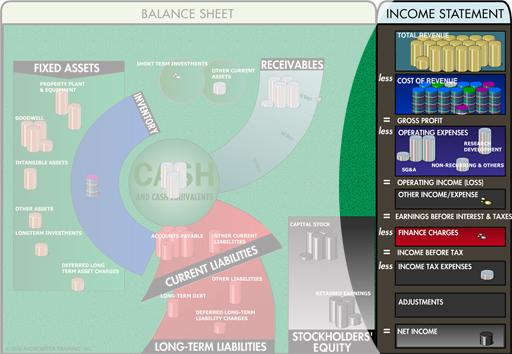
A weighted average of the interest cost of debt and the expectations of the shareholders.
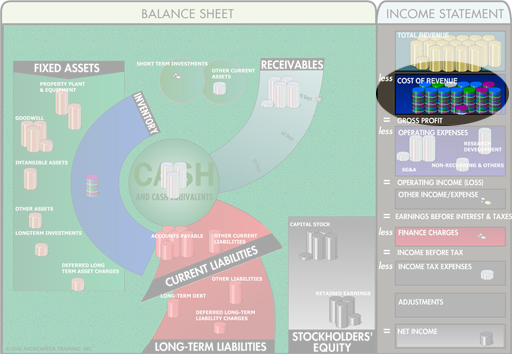
The variable (direct) costs of products and/or services provided to customers. Typically includes raw materials and labor, and other components on a company-by-company basis. Individual components might include sales commission and depreciation. Also called Cost of Goods Sold (COGS) or COGS.
COS is a variable cost because the cost reported varies with sales volume. Conceptually, Direct Costs, Cost of Sales and Variable Cost are very similar. Check how each term is used in your company.
Also called Cost of Goods Sold (COGS).


D
Ratio: Creditors divided by the Average Daily COS (Annual Sales/365).
The ratio shows the company’s average payable period.
Part of the Cash Conversion Cycle.
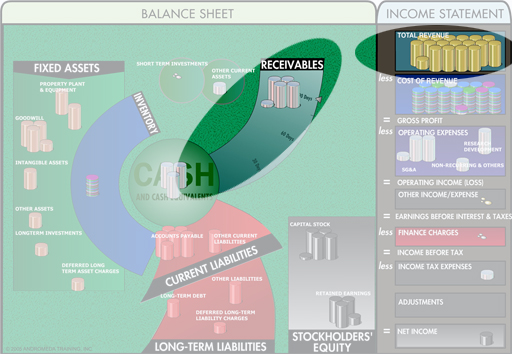
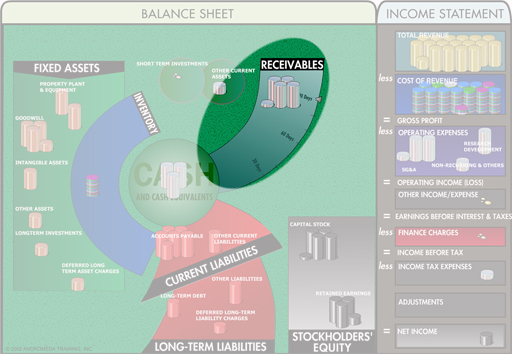
Ratio: Debtors divided by the Average Daily Sales (Annual Sales/365).
The ratio shows how quickly the proceeds from sales are converted into Cash.
DSO is also known as Days Sales in Receivables (DSR) or Average Collection Period.
Part of the Cash Conversion Cycle.
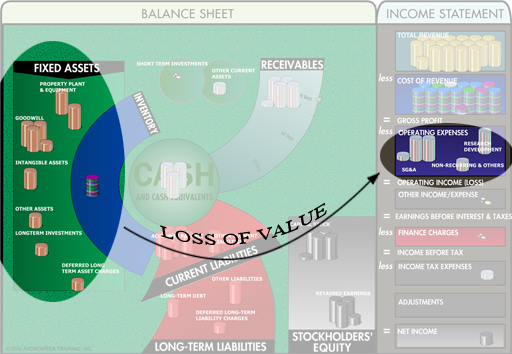
Non-cash expense (reported on the Income Statement) that expresses the reduction in economic value of Assets over time.

A calculation of the future value of expected inflows and outflows of Cash.
Future cash flows need to be appropriately discounted to allow for the fact that money that comes back in next year is worth less than money that goes out today.
Reduction in the sales price of goods and services to entice additional sales. Often based on volume, seasonality, obsolescence, a changed competitive environment, or future commitments by the customer.
A distribution to shareholders of a portion of Earnings.
Ratio: Net Income divided by Dividend
The ratio shows the ratio of Profit to Dividends paid. If this number is greater than 1, it means the business has reinvested some profit back into itself – the higher the number the greater the re-investment.
Some companies occasionally pay Dividends greater than their Earnings; this may happen if they take a temporary loss and want to send a signal that the loss does not matter. Failing to pay an expected dividend signals that the company has run into unexpected difficulty, and this will hurt the price of shares. It shrinks the size of the business to pay a dividend greater than earnings, but a high stock price is important if the company want
E
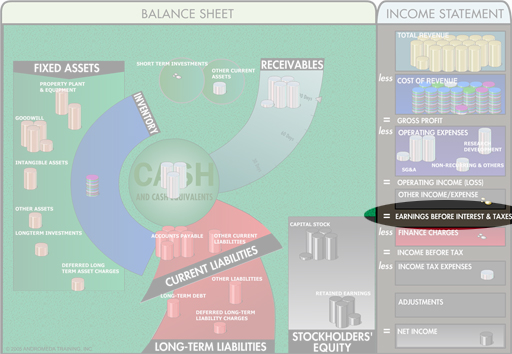
Calculation: Sales less all costs and expenses
Net Income or Net Profit for the period.
F
A cost incurred in the general operations of the business that is not directly attributable to the costs of producing goods and services. These ‘Fixed’ or ‘Indirect’ costs will be incurred whether or not any sales are made during the period, thus the designation ‘Fixed’ as opposed to ‘Variable Costs’.
G

Gross Income
Calculation: Sales less Direct Cost less Overhead(s).
Gross Margin
Ratio: Gross Income as a percentage of Sales
Gross Income is the amount of profit available after deducting from sales the direct (or variable) costs of labor and materials, and the costs of the overheads applied to the production of goods and services.
This is a real What do you mean by that? with people sometimes using the two terms interchangeably. We use ‘margin’ to denote a percentage (of Sales).
Example:
- Sales of 200 less COS of 80 less factory overheads of 10 equals Gross Income of 110.
- Gross Income of 110 divided by Sales of 200 equals Gross Margin of 55%.
Gross Income
Calculation: Sales less Direct Cost less Overhead(s).
GROSS MARGIN
Ratio: Gross Income as a percentage of Sales
Gross Margin is the percentage of profit available after deducting from sales the direct (or variable) costs of labor and materials, and the costs of the overheads applied to the production of goods and services.
This is a real What do you mean by that? with people sometimes using the two terms interchangeably. We use ‘margin’ to denote a percentage (of Sales).
Example:
- Sales of 200 less COS of 80 less factory overheads of 10 equals Gross Income of 110.
- Gross Income of 110 divided by Sales of 200 equals Gross Margin of 55%.
I
Ask What do you mean by that?. It could mean Sales Income (Sales Revenue at the top of the Income Statement), or it could mean Net Income (Net Profit at the bottom of the Income Statement).
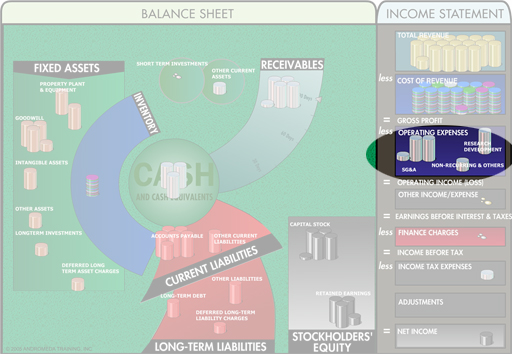
A cost incurred in the general operations of the business that is not directly attributable to the costs of producing goods and services. Compare to Direct Cost.
See also Fixed Cost vs Variable Costs.
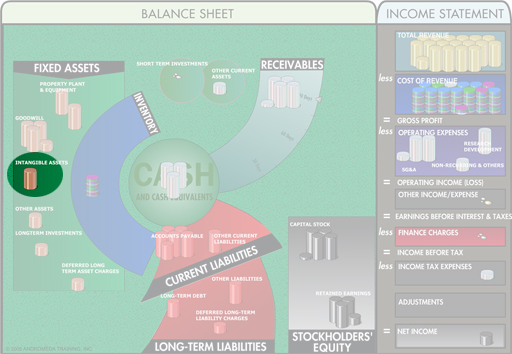
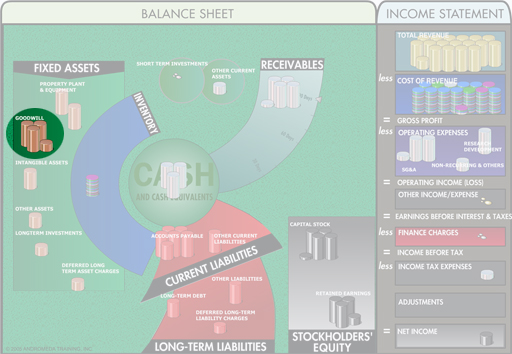
Copyrights, Patents, Trademarks and Service Marks.
Raw materials, work in process (WIP), and finished goods.
L
LEVERAGE is how much you extend your Assets by borrowing against your investment.
See also Leverage Ratios.
LEVERAGE RATIOS incorporate any two of the following: Assets, Equity, Liabilities.
Example:
If you invest $60K of your money in a business, and borrow an additional $30K from the bank, you have assets of $90K. You can express your leverage in several ways:
Debt to Equity : 30/60 = .5
Debt Ratio (i.e. Debt to Assets): 30/90 = .33
Both these numbers are expressing the same situation, and both can be called leverage. One person might say “We’re leveraged 50%”, while another could say “We’re leveraged 33%.”
See also Leverage.
Be sure to ask, What do you mean by that?.
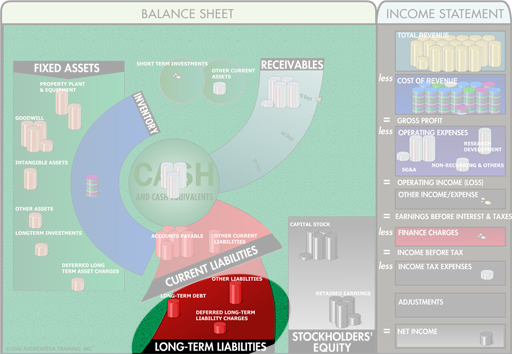
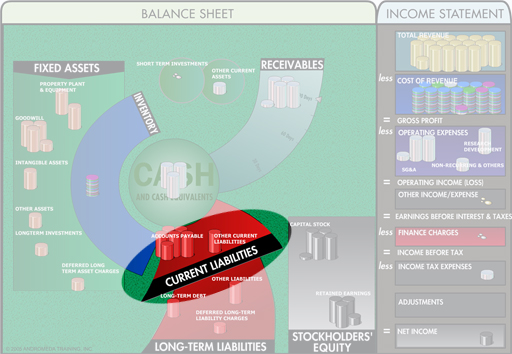
Liabilities which have a payment period exceeding one year; includes bank loans, bonds, etc.
M
N
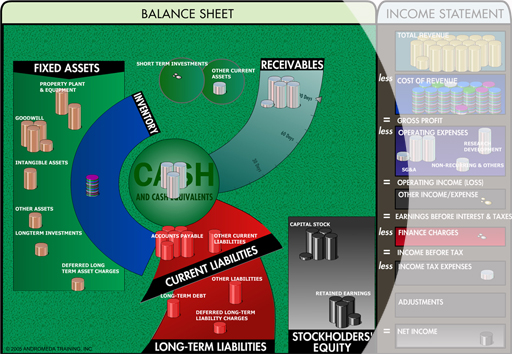
A Balance Sheet balancing the Total Assets less non-interest bearing liabilities against the combined total of Interest-Bearing Liabilities and equity.
This version of the Balance Sheet has advantages for measuring management performance, and is prevalent outside North America.
See also Total Asset Balance Sheet.
What do you mean by that? Any term which uses the phrase ‘net asset’ or ‘net assets’ must be examined closely. See Net Asset; Net Assets.
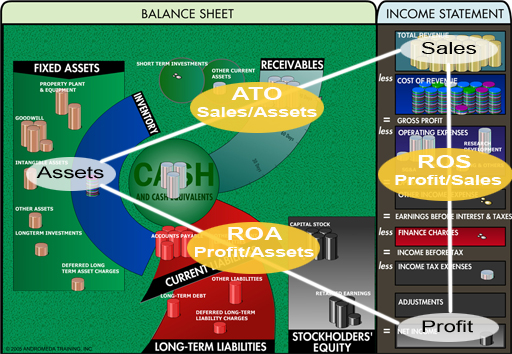
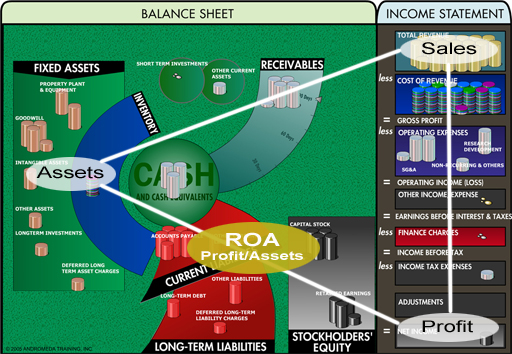
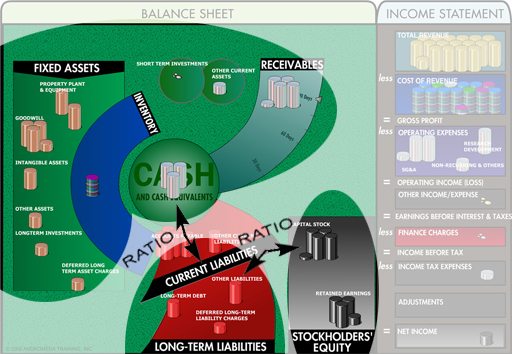
Ratio: Sales divided by Net Assets
This ratio measures how asset-intensive a business is and the efficiency of the assets employed.
Asset Turnover shows the speed with which an amount of cash, equivalent to the money invested in the business by head office, comes back in through the door in fresh sales. It isn’t concerned with profit, only with cash flow. If sales are rapid, little cash is tied up to keep the business going; which may make it easier to expand.
See also Income/Outcome Triangle for Ratio Analysis, Return on Net Assets (RONA), Asset Turnover (ATO).
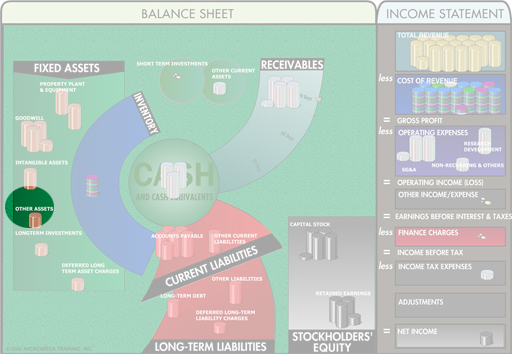
Calculation: Total Assets less Intangible Assets less Liabilities.
This is the amount of cash you would have if everything owned by the business was sold, and all debts were paid. It is a very conservative ‘worst-case’ valuation of what a business would be worth if it had to close down.
Be sure to ask, What do you mean by that? Any term which uses the phrase ‘net asset’ or ‘net assets’ must be examined closely. See Net Asset; Net Assets.
Calculation: Total Assets less Non-Interest Bearing Liabilities
Net Assets are that portion of Total Assets funded by Corporate HQ long-term financing and share capital.
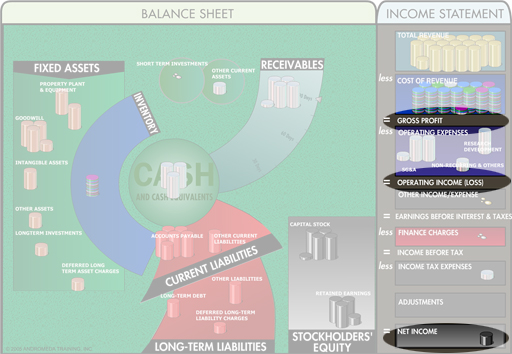
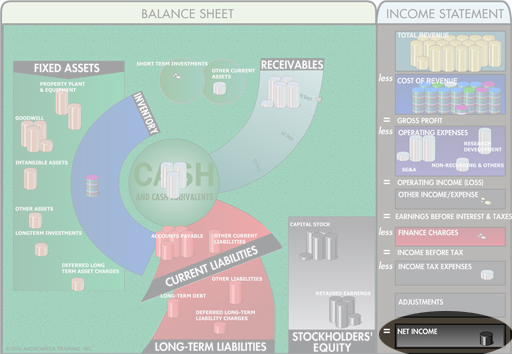
Net Income
The Profit left for the owners, after all costs, expenses, interest and taxes have been paid. Also called Net Profit.
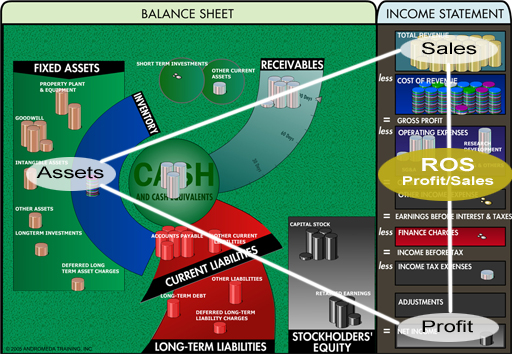
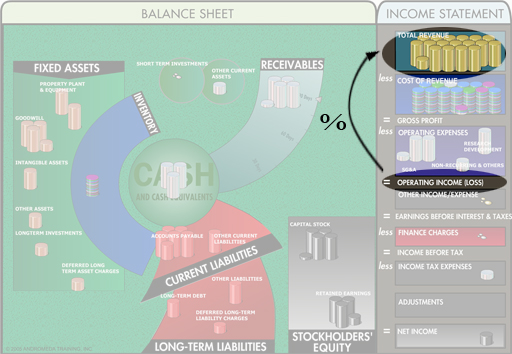
Return On Sales (ROS)
Ratio: Net Income as a percentage of Sales
Net Income (or Net Profit) is the Profit left for the owners, after all costs, expenses, interest and taxes have been paid.
Example:
• Sales of 200 less COS (80) less Operating expense (70) less interest expense (20) and income tax (10) leaves Net Income of 20.
• Net Income of 20 divided by Sales of 200 equals Return on Sales of 10%.
NPV is used to determine when, if ever, a capital investment will generate a profit, and how much that will be in today’s terms. The Net cash flows are considered in today’s terms (i.e. Present Value), because the money that comes in next year will be worth less than the money that goes out this year.
O
Operating Income
Calculation: Sales less Cost of Sales (COS) less Operating Expense.
Operating Margin
Ratio: Operating Income as a percentage of Sales.
Operating Income is one of many possible finance terms for the same concept. It can also be known as:
Earnings Before Interest and Tax (EBIT),
Operating Profit,
Measured Operating Income (MOI),
Profit Before Interest and Tax (PBIT) in the United Kingdom,
Result No. 3 in Germany,
The Primary Result in Denmark.
This is a real What do you mean by that? with people sometimes using the two terms interchangeably. We are using ‘margin’ is to denote a percentage (of Sales).
Example:
- Sales of 200 less COS of 80 less Operating expense of 70 leaves Operating Profit of 50.
- Operating Profit of 50 divided by Sales of 200 equals Operating Margin of 25%.
Deposits, bonds and securities which are not included in Cash, but can be readily converted into cash.
P
Ratio: Price per Share divided by Earnings Per Share (EPS).
This is the number of years it will take for the investment to be paid back by Earnings at the current rate, and thus reflects the confidence that investors feel in the company.
Ratio: Price per Share divided by Book Value per Share.
This is a measure of the safety of an investment: how well is the investment covered by assets if the worst things happen and the company closes operations?
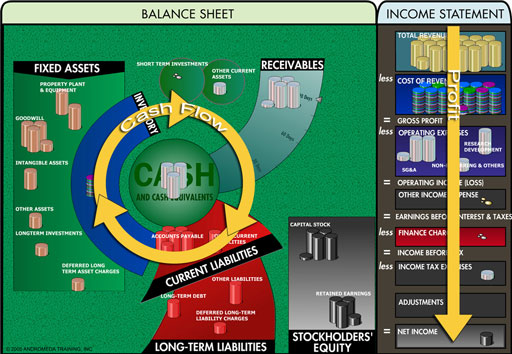
Understanding the Cash Flow of a business is as essential as understanding Profit.
Profit is like food - you need it for the business to grow and to be healthy and strong; but you don’t have to eat all the time. But cash is like air – you need it constantly. If you run out, and cannot immediately get more, you die.
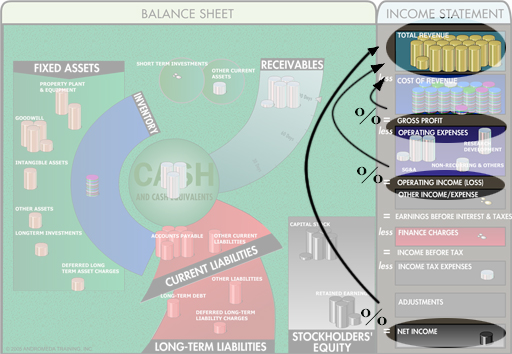
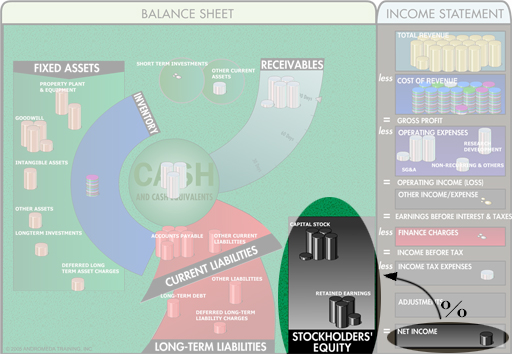
Profit happens on the Income Statement. Cash happens on the Balance Sheet. The two have to be managed separately.
The Profit or Loss for the period, as reflected on the Income Statement.
‘The P&L’ is also used as another name for the Income Statement.
Gross Margin: Gross Income or Gross Profit as a percentage of Sales
Operating Margin: Operating Income or Operating Profit as a percentage of Sales
Return on Sales: Net Income or Net Profit as a percentage of Sales
This number describes what income is left over after expenses are deducted from sales.
What do you mean by that? We use ‘margin’ is to denote a percentage (of Sales).
People will think of profit margins at different points on the Income Statement. Production might look at Gross Margin while operations might look at Operating Margin; the Finance Department looks at Return on Sales.
Q
R
Ratio: Net Income as a percentage of the Shareholders’ Equity.
ROE measures how effectively the Shareholders’ investment has been put to work to create profit. Also known as Return on Investment.
S
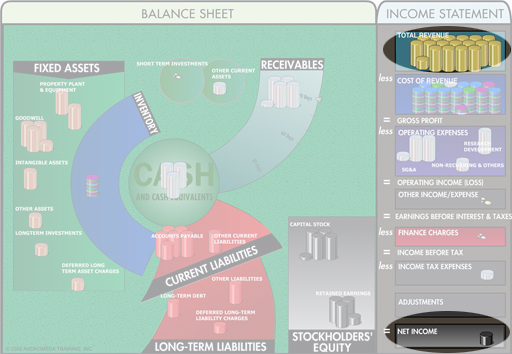
Revenues from the sale of goods and services which are part of the company’s regular operations.
What do you mean by that? The term ‘Sales’ generally refers to Net Sales which is the number used in the Financial Statements.
The term ‘Total Sales’ could refer to Gross Sales or Net Sales.
Analysis of sources of cash that flowed into the business together with how cash was allocated, for the accounting period.
The information is grouped by functional department, because Cash can be freed up from anywhere (such as getting customers to pay faster, or paying suppliers more slowly), not just from Sales or the Finance Department.
Note: Cash Flow does not consider non-cash items such as depreciation.
Typically means Inventory. In North America, it is more likely to mean shares (e.g. Shareholder Equity).
T
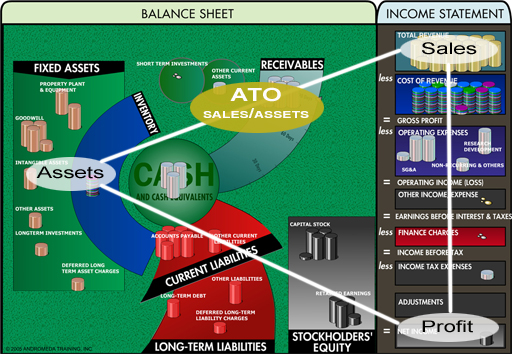
A 3-dimensional landscape of the financial results of a business developed by Andromeda Training, Inc.
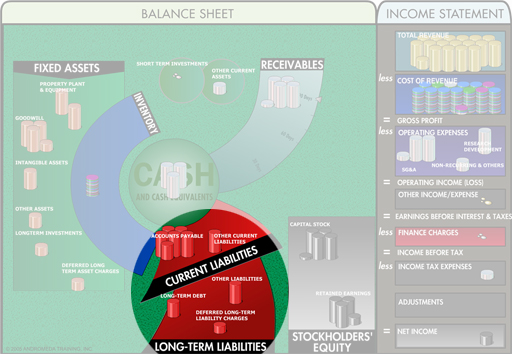
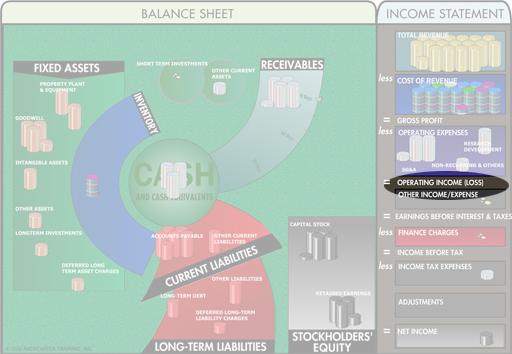
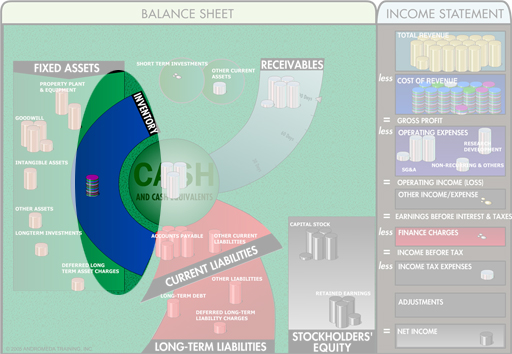
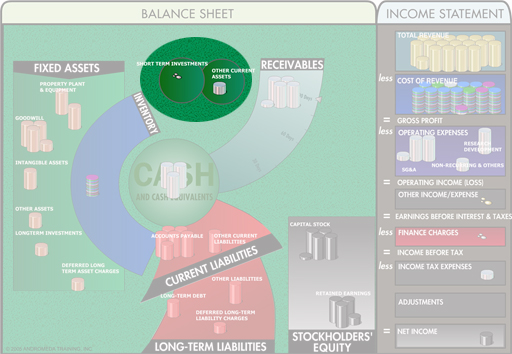
A Balance Sheet balancing the total Assets against the combined total of Liabilities and Equity.
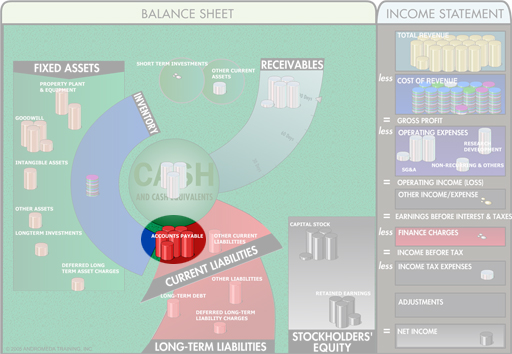
This is the simplest representation of Balance Sheet information, and is prevalent in North America. It shows the assets (what you have in the business) and balances that amount against the total of liabilities and equity (which is where the assets came from). In other words, everything you have in the business comes from investing (Capital Stock), making money (Retained Earnings ), or borrowing from sources such as banks (Loans) and suppliers (Accounts Payable (A/P) ).
See also Net Asset Balance Sheet.
Revenues from the sale of goods and services which are part of the company’s regular operations.
What do you mean by that? The term ‘Sales’ generally refers to Net Sales which is the number used in the Financial Statements.
The term ‘Total Sales’ could refer to Gross Sales or Net Sales.
V
W
The definitions given here are our generic explanations of common corporate financial terminology. Actual meanings can vary wildly from company to company; in order to have the correct internal definition you need to ask your Finance Department, "What do you mean by that?"