|
The Income/Outcome® Contextuarya visual glossary of corporate finance |
|
Income/Outcome Business Simulations Home
|
|
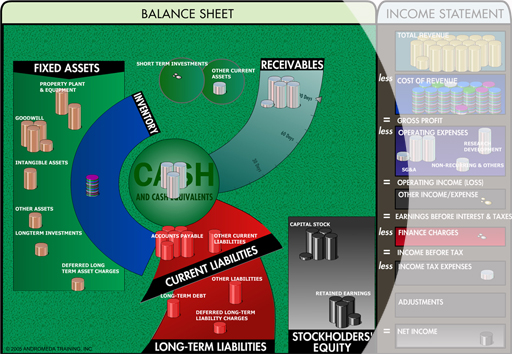
We use "business visualization" to graphically simplify complex business concepts (and increase business acumen). To get more information on business visualization, please see "The Company Board" (our business results visualizer) and Income/Outcome (our customizable business simulation).
The following are our generic explanations of common corporate financial terminology. Actual meanings can vary wildly from company to company; in order to have the correct internal definition you need to ask your Finance Department, "What do you mean by that?"
To get more information about the authors, please see our Directory of Contributing Editors.


 term list.