- Sales and other revenues (e.g. Investment or Adjustments) are represented by gold stacks
- Cost of Goods Sold (or Cost of Sales) are represented by blue stacks.
- Cash Expenses are represented by silver stacks.
- Depreciation and Amortization are epresented by copper stacks.
- Net Income (Profit for the period) is represented by black stacks. (A loss is outlined in red)
The Balance Sheet Equation: Assets = Liabilities + Equity
- Current Assets include:
- Cash, Receivable, and Other which are represented by silver stacks.
- Inventories which are represented by blue stacks.
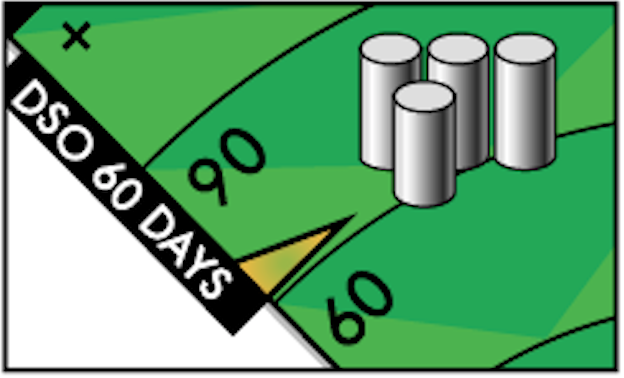
Days Sale Outstanding is automatically calculated:
- Fixed Assets are epresented by copper stacks.
Liabilities are represented by red stacks.
Equity are represented by black stacks. (Negative equity is outlined in red)
Key Ratios in Visual Finance
- Return on Sales (ROS) shows what percentage of the sales revenue is left after you have paid costs and expenses.
ROS = Net Income/Sales x 100%
- Return on Assets (ROA) measures how effectively the assets are employed in the business.
ROA = Net Income/Assets x 100%
- Asset Turnover (Asset Turns) tells you how many times you ‘turned over’ your assets during the period.
ATO = Sales/Assets


 term list.